| Ignore Breaks In Data |
| Smooth and Smooth / Adjust |
| Shift / Rotate |
| Transform |
TRIOS software contains a variety of analysis functions that are specific to the selected data. For information regarding accessing and using these functions, follow the general instructions found in Analyzing Data.
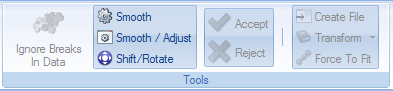
In addition to the analysis described in the Analyzing Data Help topic, use the following Analysis Tools (toolbar shown below) to further customize your data analysis.
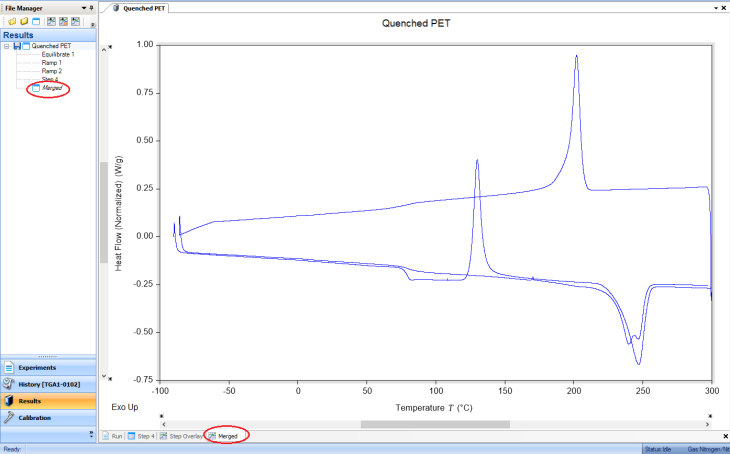
Use Ignore Breaks in Data to analyze data across multiple steps. The data from all steps is combined into a new Merged step.

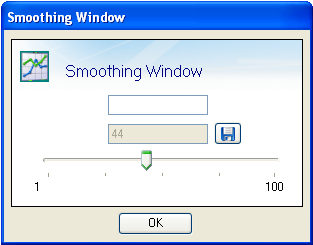
The smoothing tool operates on full curves. Several smoothing techniques are available in TRIOS (Polynomial, FFT, and Least-squares). Set your desired default option within the TRIOS Options > Analysis page. The extent of the smoothing is determined by the window size.
The process of curve shifting and curve rotation causes a linear change to a curve's baseline. Curve shifting moves all of the data points on a curve up or down by a fixed value. Curve rotation moves the data points on a curve up or down by a linearly changing value.
Curves are shifted by adding a fixed offset to the Y-value of each data point on the curve. When curve shifting is done manually (as described below), the offset is the difference between the cursor Y-position and the interpolated curve value at the cursor X-position. Or, stated differently, the point on the curve at the vertical cursor is moved to the cursor position, and all other points on the curve are moved up or down by this same amount.
To shift the curve, follow these steps:
 icon is used to pivot the curve at the selected point in the curve vertically. The pivot point is based on second cursor location .
 icon is used to move the curve up or down to the position of the horizontal bar of this marker location.
marker and move it horizontally to the desired location on the curve.
icon is used to move the curve up or down to the position of the horizontal bar of this marker location.
marker and move it horizontally to the desired location on the curve.
Curves are rotated by adding a computed offset to the Y-value of each data point on the curve. The offset for each data point is computed to be the difference between the Y-value of the data point and the Y-value of a straight line evaluated at the X-value of the data point. When curve rotation is done manually, the straight line is defined by the X- and Y-coordinates of the two cursor positions. The slope and offset of this line is used to compute the offset at each data point. Or, stated differently, the two points on the curve at the vertical cursors are moved to the cursor positions, and all other points on the curve are moved by a proportional amount.
Use the Rotate option to take the curve and rotate it around the points chosen. Follow these steps to use this function:
icon is used to pivot the curve at the selected point in the curve vertically. The pivot point is based on the second cursor location.icon is used to move the curve up or down to the position of the horizontal bar of this marker location . marker and move it horizontally to the desired location on the curve. This point serves as the pivot point. marker and move vertically to the desired location, pivoting off the second cursor point.When rotating a curve that will subsequently be integrated, be sure to rotate the curve using the same x-axis domain as that of the integration (typically Time).
Rotating a curve in the Temperature domain and then integrating the curve with respect to Time (for example, via Peak Integration analysis) can result in incorrect integration values, because typically Time and Temperature are not linearly related.
In general, you should never rotate a curve in the Temperature domain if you plan to integrate it. The best approach is to rotate the curve with Time selected on the X-axis, and then use Graph > X Axis > Temperature to change back to the temperature domain. Now the rotated peak integration will give the same result as the non-rotated integration.
Typically, transformations are performed on complete data sets from the File Manager (refer to Transforming Data). Certain transformations can also be performed on a selected number of data points in an active document using the Transform menu.
Follow the procedure below to perform a transformation on a single step of a data file selected in the document view using the Transform menu:
