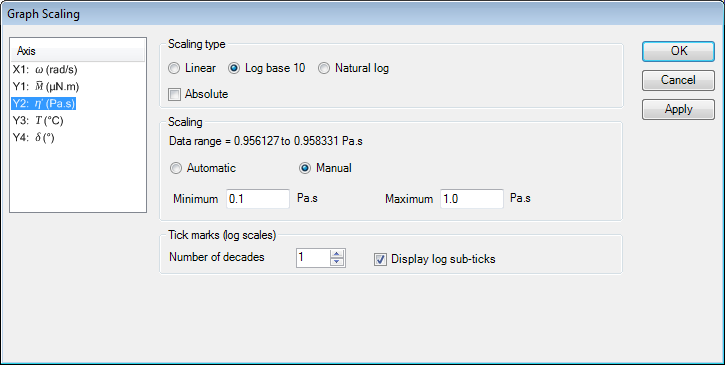
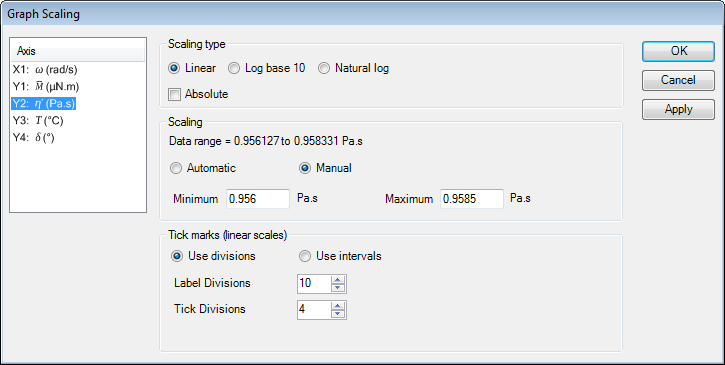
Manually Rescaling a Graph
Use manual scaling options to set the plot to specifically defined limits, as well as to specify properties such as scaling type (linear, log, or absolute) and tick mark preferences.
In order to use the functions below, open a TRIOS data file and select the Graph view.
Accessing the Manual Rescale Window
To access the scaling functions, use one of the following methods:
- Right-click on an axis and select Scaling
 from the pop-up menu.
- Select Formattab > Scalingtoolbar > Manual
 .
.
Using the Manual Rescale Window
To rescale your selected axis manually:
- Select the desired Scaling type: Linear,
Log base 10, or
Natural log.
- Check the Absolute (scaling) box to display all negative values as positive.
- Select Manual as your scaling type. When data is first displayed, Automatic scaling is used.
- Enter the desired Minimum and Maximum axis limits.
- The minimum limit determines the signal value at which the axis begins.
- The maximum limit determines the signal value at which the axis ends.
- By default, the current values display when you switch between automatic and manual scaling options; values displayed are based on your scaling type selection.
- For log axis scaling, the limit must be at a full decade interval.
- Enter the desired Tick mark parameters. The displayed options are based on the scaling type selection.
Log Scale

- Enter the desired Number of decades per major tick interval.
- Select Display log sub-ticks to show tick interval within a decade.
Linear Scale

- Select between Use divisions (total # of ticks) and Use intervals (define tick interval based on signal value). The label interval determines how often the axis is numbered.
-
If Use divisions is selected, enter the desired number of Label divisions and Tick divisions for your label marks.
-
If Use intervals is selected, enter the desired Label interval, Tick interval, and Label offset.
- NOTE: The offset is the place on the axes where you want the first label to appear. The first label offset enables you to start labeling the graph at any point you choose. For example, if the axis starts at 0.03, but you want the first label to appear at 0.05, enter 0.02 (the difference between the start limit and the point on the axis where you want the first label to appear).
- Click OK when completed. The graph will be rescaled using all of the options chosen.
Back to top

