| Overview |
| Calculating the Derivative in TRIOS |
Although the derivative of a mathematical curve can be determined exactly, the derivative of a curve of data points is always an estimation or average of the slopes of lines between points.
In TRIOS, the derivative of a signal is computed by determining the slope of a fitted line or fitted curve at each point along the data curve. The fit is made using the method of least squares. The region over which the fit is made is a window of data points equal to the width of the signal-smoothing window (See Tools/Smooth).
For example, if one data point is taken each second and the derivative smoothing window is 0.2 minutes (12 seconds) then the curve fit window is 12 data points wide. The first derivative for each curve point is computed by fitting the 12 data points of the window to a straight line and then evaluating the slope of the line at the center of the window. The window is then moved along the curve by one data point and the process is repeated until a fit and slope determination has been made at every data point along the curve. For second order derivatives, the data is fit to a quadratic and evaluated at the center of the window. At the ends of the derivative curve, and at any breaks in the data, the slope value will be skewed away from the center of the window.
TRIOS permits the user to set/inspect the window for the derivative calculation using the Tools/Smooth function. Reducing the size of the window will increase the noise in the computed derivative signal, but give a more precise result. A minimum window of five data points is always used to compute the derivative at each point, even if the Time/Temperature window is set so small that fewer than five data points would actually fall within the window. In this case the window is automatically expanded during the calculations to include at least five points.
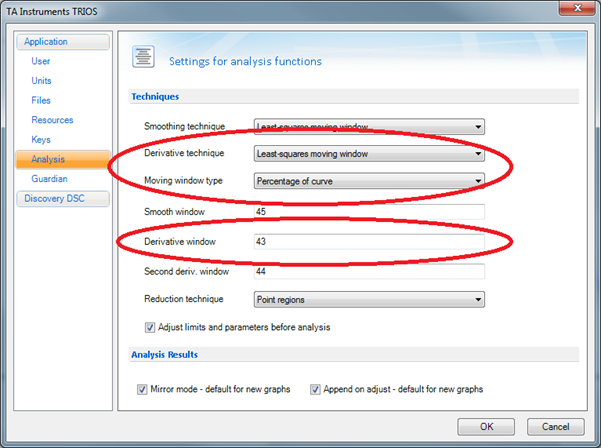
There are three methods available for the calculation of derivative signals in TRIOS. The method used is specified in the Analysis Options page, accessible from the Analysis ribbon tab or the Analysis tab of the TRIOS Options:
The derivative is calculated using a simple central different formula:
f’(xn) =(f(xn-1) + f(xn + 1)) / (xn+1 – xn-1)
For second derivatives the calculation is performed twice, once to obtain the derivative and again to obtain the second derivative.
Note that when central difference is selected the derivative window (see below) has no effect.
The derivative is calculated using a clamped cubic splines technique. Note that when cubic spline is selected the derivative window (see below) has no effect.
The derivative is calculated using a moving window with straight-line least-squares fitting. This is the factory default setting for calculating derivatives.
For second derivatives the calculation is performed twice, once to obtain the derivative and again to obtain the second derivative.
The window size may be adjusted by setting the derivative window % and second derivative window % values (see below).
The moving window can either be a fixed number of points or a percentage of the curve. The factory default is Number of points, 5 points.
If the moving window type is Percentage of curve, the specified window size (1 – 100%) used in calculating the derivative. Technical note: the scale 1 – 100 is presented for ease-of-use. The actual % of the curve considered ranges from 0.1 to 20.0 exponentially.
See also:
Basic Steps to Analyzing Data (using the Derivatives toolbar)
