| Customizing the Application Settings |
| Accessing Properties |
| Customizing the TRIOS Layout |
The appearance of many of the components in TRIOS can be customized. You can customize settings that apply to the entire program, or select properties that apply to individual components within the application.
For an overview of document properties and how they work, refer to Understanding Document Properties.
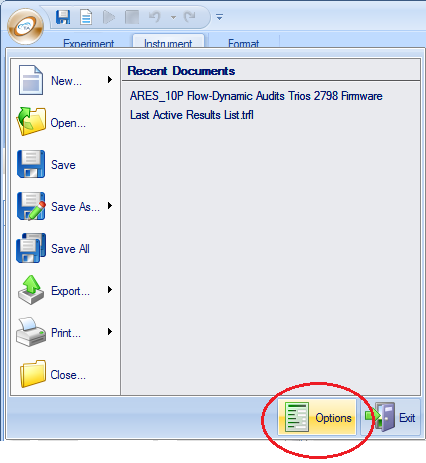
To select the application options, follow these steps:
Individual components within TRIOS are customized through the Properties panel.
To access this panel:
Follow the tips below when using a Properties panel:
See Also
Saving and Restoring Property Settings
Customize the color scheme of the bars displayed in the Experiment panel as follows:
 at the bottom of the window.
See Also
Saving and Restoring Property Settings
The spreadsheet properties allow you to customize the general properties (such as font and color) associated with the spreadsheet. Follow these steps to customize the general spreadsheet properties:
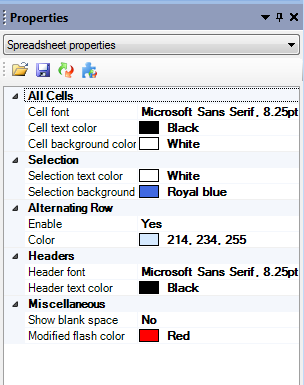
- All Cells: Choose the desired font and size, text color, and cell background color to apply to all cells in the spreadsheet.
- Selection: You must first select the desired cells to change, then set the text color and background color using this property.
- Alternating Row: If you want a different color for alternating rows in your spreadsheet, set "Enable" to Yes then select the desired color. If you do not want a different color for alternating rows (all cells will be the same), set "Enable" to No.
- Headers: Use this property set to choose the desired color and font to be used for the column header text.
- Miscellaneous : Set "Show blank space" to No to hide any empty cells or to Yes to show any empty cells. The color selected for "Modified flash color" is used as an indicator that data was modified.
See Also
Saving and Restoring Property Settings
The spreadsheet content properties allow you to customize the selected variable, units, label, numerical format, and precision. (These settings are also available using the spreadsheet menu.) Follow these steps to customize the spreadsheet content properties:
See Also
Saving and Restoring Property Settings
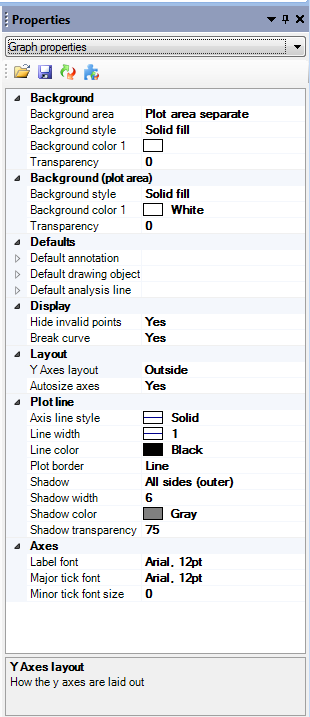
The graph properties allow you to customize the general graph settings, such as color, plot line, legend display, y-axes layout. Many of these common functions are also available through the Graph and Curves tabs. Follow these steps to customize the general graph properties:
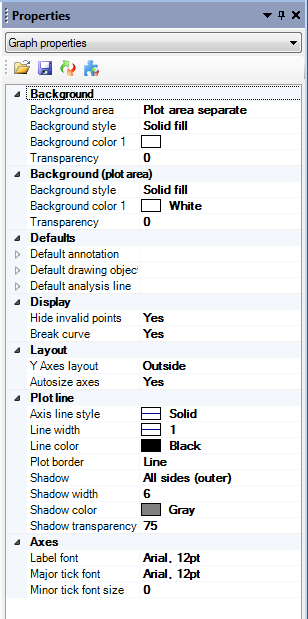
- Background: Use this set of properties to set up the background area, background style, color, and transparency .
- NOTE: Once the separate plot area and border is chosen, two background style options areas will be displayed—one for the plot area and one for the border.
- NOTE: With the Solid Fill option selected, one color option will be displayed.
- Defaults: Use this set of properties to set the default conditions for the graph annotations and/or drawing objects. When one or more default objects are displayed, they each have their own unique settings that can be modified. These settings are not saved as part of the presentation; only the defaults are saved.
- Display: Choose yes or no to enable or disable display of the legend, plot title, invalid points, and breaks in the curve. Invalid points are defined through the spreadsheet.
- Layout: Select from the drop-down lists to set up the properties Y Axes layout and Autosize axes.
- Plot Line: Use the plot line options to set up various border effects around the plot. Border line style, width, color, and effects may all be modified using these options.
- Axes: Use this set of properties to modify the label font typeface and size, major tick font typeface and size, and minor tick font size.
See Also
Saving and Restoring Property Settings
The axis properties allow you to customize the axis settings such as variable selection, scaling, tick mark, and color preferences. Follow these steps to customize the axis properties:
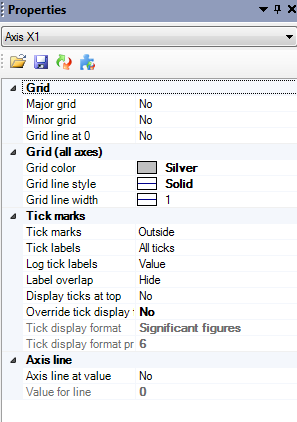
- Grid: To apply grid lines to a single axis’ tick divisions, select Major grid or Minor grid. You can also configure a single grid line through zero.
- Grid (all axes): Select the grid color, line style, and line width from the list of available options.
- Tick marks: Select from the displayed options to customize the tick mark display, labels, font type and size for major and minor ticks, and to customize log tick marks. Using these options you can turn the tick marks on or off. Select the position of the tick marks to display them on the outside, inside, or through the axis line. You can also choose to display ticks at major tick intervals, or display them at the minimum and maximum values of the plot.
- Axis Line: Set "Axis line at value" to Yes to display the axis line at your entered value.
See Also
Saving and Restoring Property Settings
Enable the legend by selecting Format tab > and selecting the Legendoption from the Show toolbar.

To customize the legend, select Legend from the Format tab, and then make your customizations using the Legend menu.
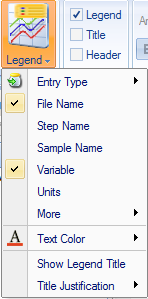
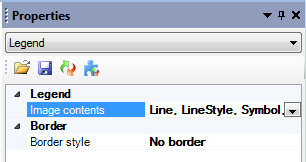
Additionally, click on the Legend and then right-click and select Properties from the pop-up menu. Then select Legend from the drop-down menu. The Legend properties allow you to customize display settings such as image contents and border preferences.
Click on the desired property to display either an arrow ![]() or button
or button ![]() . Then choose your option from the drop-down list or window.
. Then choose your option from the drop-down list or window.
See Adding Objects to a Graph for more information regarding customizing the Legend.
See Also
Saving and Restoring Property Settings
Enable the graph title by selecting Format tab and then clicking Title from the Show toolbar. Once the title is enabled, use the Format tab to customize the display settings, such as font and color.
Use the border options in the Properties panel to set up various border effects around the title. Border line style, color, and shadow effects may all be modified. Shadow transparency uses the shadow color specified (0 = fully transparent, 100 = no transparency).
See Also
Saving and Restoring Property Settings
After you have created a graph object (see Adding Objects to a Graph for instructions), you can alter the shape fill and shape outline properties of that object from the Shape toolbar in the Edit tab. Transparency saturation using the fill color specified (0 = fully transparent, 100 = no transparency) can be altered from the Properties panel.
Follow these steps to access the Properties panel:
For information on customizing annotations, see Adding Objects to a Graph.
See Also
Saving and Restoring Property Settings
To change the default units for the whole program, see Setting TRIOS Options.
See Also
Saving and Restoring Property Settings
In addition to being able to customize the properties of various components in TRIOS, you can also set up the workspace as desired.
For information on changing the workspace, see Customizing the TRIOS Panel Layout.
