You are here: Evaluating Data > Understanding the Graph View > Adding Objects to a Graph
Adding Objects to a Graph
TRIOS software offers the ability to modify graphs by adding annotations, shapes, and a variety of other customizable features. You will use three main toolbars to add and format various objects. To enable the functions on these toolbars, open the desired data file and select the desired graph tab at the bottom of the panel. Then select the desired function from the Graph view:
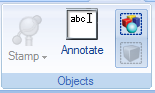
- Use the Objects toolbar to add annotations, select objects on the graph, and add stamp values to points on the curve.To access the Objects toolbar (shown below), select the Edit tab.
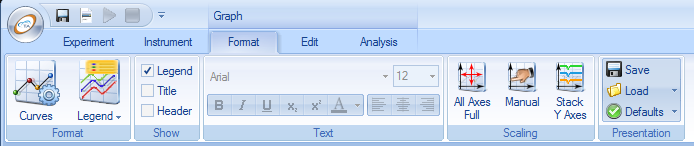
- Use the Format toolbar to customize the appearance of the curves or text in an object. To access the Format toolbars (shown below), select the Format tab.
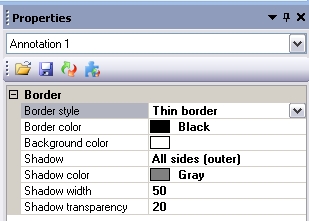
- Use the Properties menu to customize the object frame appearance with borders, shadows, etc. To access the Properties menu (shown below), right-click on your graph or spreadsheet and click Properties. The menu appears in the right panel of the TRIOS software.
Adding a Curve Value
The Curve Value feature allows you to stamp data onto any point of the curve. Given a selected point, you can choose to stamp it with any of the following options:
- X value; Y value
- Time, temperature
- Curve statistics
See below for instructions on stamping a value on a curve.
To Stamp a Value on a Curve
- Click on the point of the curve that you wish to label. A circle appears on the point you selected, and the Stampoption
 in the Objects toolbar of the Edit tab is enabled.
- Select Stamp. Alternately, right-click on the specified point on the curve and select Stamp.
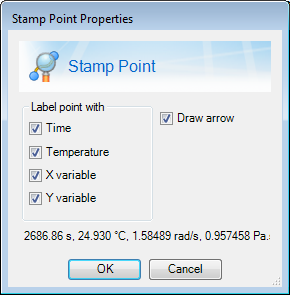
- Stamp the selected point on the curve with any of the options on the drop-down list. Select Stamp point properties to display a window that allows you to manually select between all the available label options.
Once added, the stamp frame and its text can be customized like any other object on the graph. See To Customize Annotations for additional information.
To delete a stamp frame, follow the instructions in To Delete Annotations.
Using Annotations
The annotation feature allows you to place annotation text frames anywhere in the graph. This feature is especially useful when preparing presentations or reports, as it allows you to textually expound on information presented in the graph. See below for instructions on working with annotations.
To Add Annotations
- Select Edit tab > Objects toolbar > Annotate
 .
.
- Click and drag the box to create a text frame on the plot.
- Type the desired text into the empty text frame. The text frame will expand to accommodate the text entered.
Back to top
To Edit Annotations
To edit an existing annotation, click inside the annotation frame and modify the text as desired.
Back to top
To Customize Annotations
To customize the text in an annotation or point stamp:
- Select the desired annotation by clicking on the frame.
- Select the Format tab.
- Double-click and highlight the annotation text you want to edit.
- Customize the text using the Text toolbar.
The formatting tools in the Text toolbar are common for modifying text, as they are found in most word processing software. If you are unsure of a formatting tool's functionality, scroll over the tool to highlight it (but do not click). A popup message will provide a brief description.
To modify the border characteristics of a specific annotation:
- Right-click on the desired annotation block.
- Select Properties from the right-click menu.
- Customize the border.
To modify the default properties for annotations:
- Select Properties from the right-click menu.
- Select Graph Properties from the drop-down list.
- Edit the Default annotation properties as desired.
- Border style:Select from the drop-down list to set the border around the annotation text.
- Font: Set the font type and font size for default annotation text.
- Draw line, Marker, Line width, and Line style apply only to a point stamp, not a standard annotation.
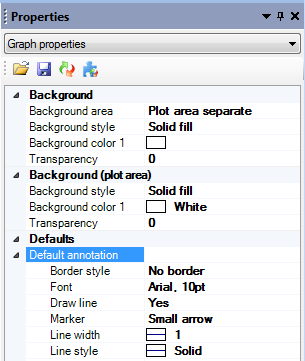
- Click Save.
To Delete Annotations
To delete an annotation from the graph:
- Move the cursor over the annotation until the four-sided arrow displays.
- Right-click and select Delete from the pop-up menu.
Back to top
To Copy and Paste Annotations
To copy and paste an annotation:
- Select the annotation.
- Right-click and select copy.
- Then right-click in another area of the graph, and select paste.
- Annotations can be copied and pasted within the same graph, or graphs from different files.
Drawing Objects
The Draw feature provides tools for inserting various shapes into the graph. Lines, rectangles, and ellipses are especially useful when calling out a particular section of the graph or curve. See below for information on drawing objects on the graph.
To Add Lines, Ellipses, and Rectangles
To add a line to your graph:
- Select Edit tab > Draw drop-down menu.
- Select the appropriate shape from the drop-down list:
- Line object

- Ellipse object

- Rectangle object

- Position the plus symbol (+) where the object is to begin.
- Click and hold left mouse button and drag to the place where the object is to end.
- Resize the object, if needed.
- Customize the object.
- To customize the transparency, right-click on the object and select Properties.
- With the object selected, select Fill or Outline from the Shape toolbar. Customize using the options in both drop-down menus.
Back to top
Managing Objects
Manage the objects in the graph using tools in the Object toolbar on the Edit tab. You can select, move, and delete objects as applicable. See below for information on managing objects.
To Select Objects on the Graph
Select objects in the graph using any of these three methods:
- To select one object, move the cursor over the object until the four-sided arrow is displayed and left-click.
- Select multiple objects at once by clicking on each object while holding the CTRL key.
- To select all objects in the graph, click Select All Objects
 .
.
You can now move the selected objects.
Back to top
To Move an Object
To change the location of an object on the graph:
- Move your cursor over the object until the four-sided arrow is displayed.
- Click and hold down the left mouse button and drag the object to the desired position.
- Release the mouse button.
Back to top
To Delete an Object
To remove an object from the graph, right-click on the object and select Delete from the right-click menu.
To Resize an Object
To change the size of an object on the graph:
- Move your cursor over the object until the four-sided arrow is displayed and left-click.
- Resize the object by placing your cursor over one of the handles until the two-sided arrow is displayed. Drag the handle to the desired position.
Back to top
Legend
Displaying the Legend
Select the Format tab on the Ribbon. To display the legend, select the Legend option on the Show toolbar. Deselect this option to hide the legend.

Customizing the Legend
Information displayed in the legend can be customized from the Legend toolbar options. Select options can be customized from the Properties.
Legend Toolbar
- Select Format tab > Legend button.
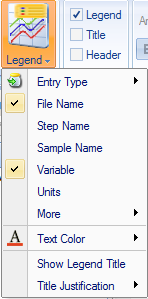
- Select the desired Entry Type.
- Every Curve
- One Per File (applicable to file overlay)
- One Per Step (applicable when more than one than one step is displayed)
- Select desired text color from the menu selection or select Use Curve Color. Use Curve Color option is only applicable when the selected Entry Type is differentiated by color. For example, if you have a file overlay and the file differentiator is color, if you select Legend Entry Type as One Per File, then Use Curve Color option is applicable.
- Select the desired parameters to display in the legend from the list of available choices (checkboxes). Additional options can be found in the More menu.
- NOTE: Another option is to double-click within the legend to manually edit the textual information.
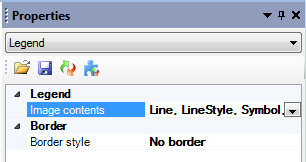
Properties Panel
Open the Properties panel by right-clicking in the graph and selecting Properties... From the drop-down menu, select Legend. Image Contents (Line, Line Style, Symbol, Extra Symbol, and Units) and Border can be adjusted here.
Back to top
