You are here: Using the DHR/AR > Monitoring the DHR/AR System
Monitoring the DHR/AR System
TRIOS software provides a variety of ways to monitor the DHR/AR system.
- Real-time plot: Once an experiment is started, it can be easily monitored. The experiment document automatically displays data in spreadsheet and graph views.
- Status Indicators: The status of each major system component is available through the status indicators at the bottom of the window display (see the image below). These indicators provide a quick overview of the current system. Below is a description of each of the indicators for a DHR or AR Rheometer.
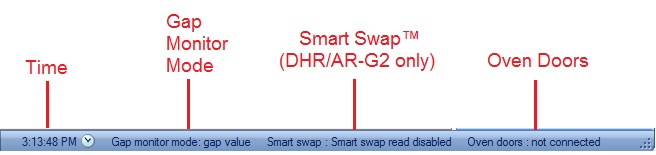
- Time – Displays the current time.
- Gap Monitor Mode – Indicates status of gap control:
- None – Display if gap is undefined.
- Gap value – Display if gap is defined and axial force control is disabled or not available.
- Axial force value – Display if gap is defined and axial force control is active.
- Smart Swap (DHR/AR-G2 only) – Indicates status of geometry Smart Swap reader.
- Oven Doors – Displays status of ETC door:
- Not connected
- Closed
- Partly open
- Open
- NOTE: The head will not move up unless the oven door status is not connected or open.
- Control panels: Each component's Control panel displays the current status and configuration information, as well as localized controls for the selected component. For more information on each of these panels select from the list below.
- Notifications Manager: The Notifications Manager contains all of the logged messages generated by the controller and by all connected instruments. Each log entry includes the Log Time, the type of message and an associated Error Code, a brief Description of what occurred, and a reference (Machine ID) indicating the source of the message.
Back to top
